I don't know about you, but my code rarely works on the first try (and if it does I immediately get suspicious). What do you do when you need to start debugging your code to ensure its doing exactly what you want it to? You are console.loging it!
In this article I'm going to explore a few tips and tricks that will greatly improve your debugging to take you to the next level as a JavaScript developer.
console.time
This method is used to time how long it takes to run a piece of code. It's a very useful tool to leverage when testing the performance of your code.
    console.time("timer");

    setTimeout(() => console.timeEnd("timer"), 2000);
Which will give the following result:

Notice the extra 3.8 ms it took to actually fire the function
Destructuring
By leveraging the power of destructuring we can easily extract the various methods the console object provides. This is useful for keeping your code DRY.
    const { log, warn, error } = console;

    try {
      log("Hello mom!");
    } catch (error) {
      error("Something went wrong");
    }
    warn("Code finished executing");
Also, in code example we used the three most basic methods that the
consoleobject provides:log,warnanderror. These can be useful for providing more valuable feedback when debugging your code.
You can also rename the methods to something potentially more meaningful:
    const { log: logMessage, warn: warnMessage, error: errorMessage } = console;

    try {
      logMessage("Hello mom!");
    } catch (error) {
      errorMessage("Something went wrong");
    }
    warnMessage("Code finished executing");
console.assert
The assert method is used to assert that a condition is true. If it is true, nothing will be logged, however if it's not true, an error will be displayed in the console.
    const one = 1;
    const emptyArray = [];

    console.assert(one === one, "one is equal to one");
    console.assert(one === emptyArray, "one is equal to emptyArray");
Which will give the following result:

console.count
This method is used to count the number of times a piece of code is executed. This is much better than writing something like console.log(fired ${count} times) for example.
    const { count } = console; // notice the use of destructuring to simplify the loop

    for (let x = 0; x < 10; x++) {
      x % 2 ? count("odd") : count("even");
    };
console.table
Useful to better display arrays and objects.
    const array = [1, 2, 3, 4, 5];

    console.table(array);

console.trace
This method shows exactly where it was fired in the code.
    function foo() {
      function bar() {
        console.trace();
      };

      bar();
    }

    foo();

console.group & console.groupCollapsed
Have you ever gone so far down the debugging hole that the had logging all over and you had no idea which ones were called when and where?
If this sounds like a familiar situation, consider using this method next time!
    const { group, groupEnd, log } = console;

    group('roles');
    log('administrator');
    log('user');
    log('guest');
    groupEnd();

If you have a lot of groups it might not always be desirable to see all the logs within the groups.
You can use the groupCollapsed method instead to immediately collapse the group and tidy up your console.
    const { groupCollapsed, groupEnd, log } = console;

    // ... some groups

    groupCollapsed('roles');
    log('administrator');
    log('user');
    log('guest');
    groupEnd();

    // ... some more groups

Debugger
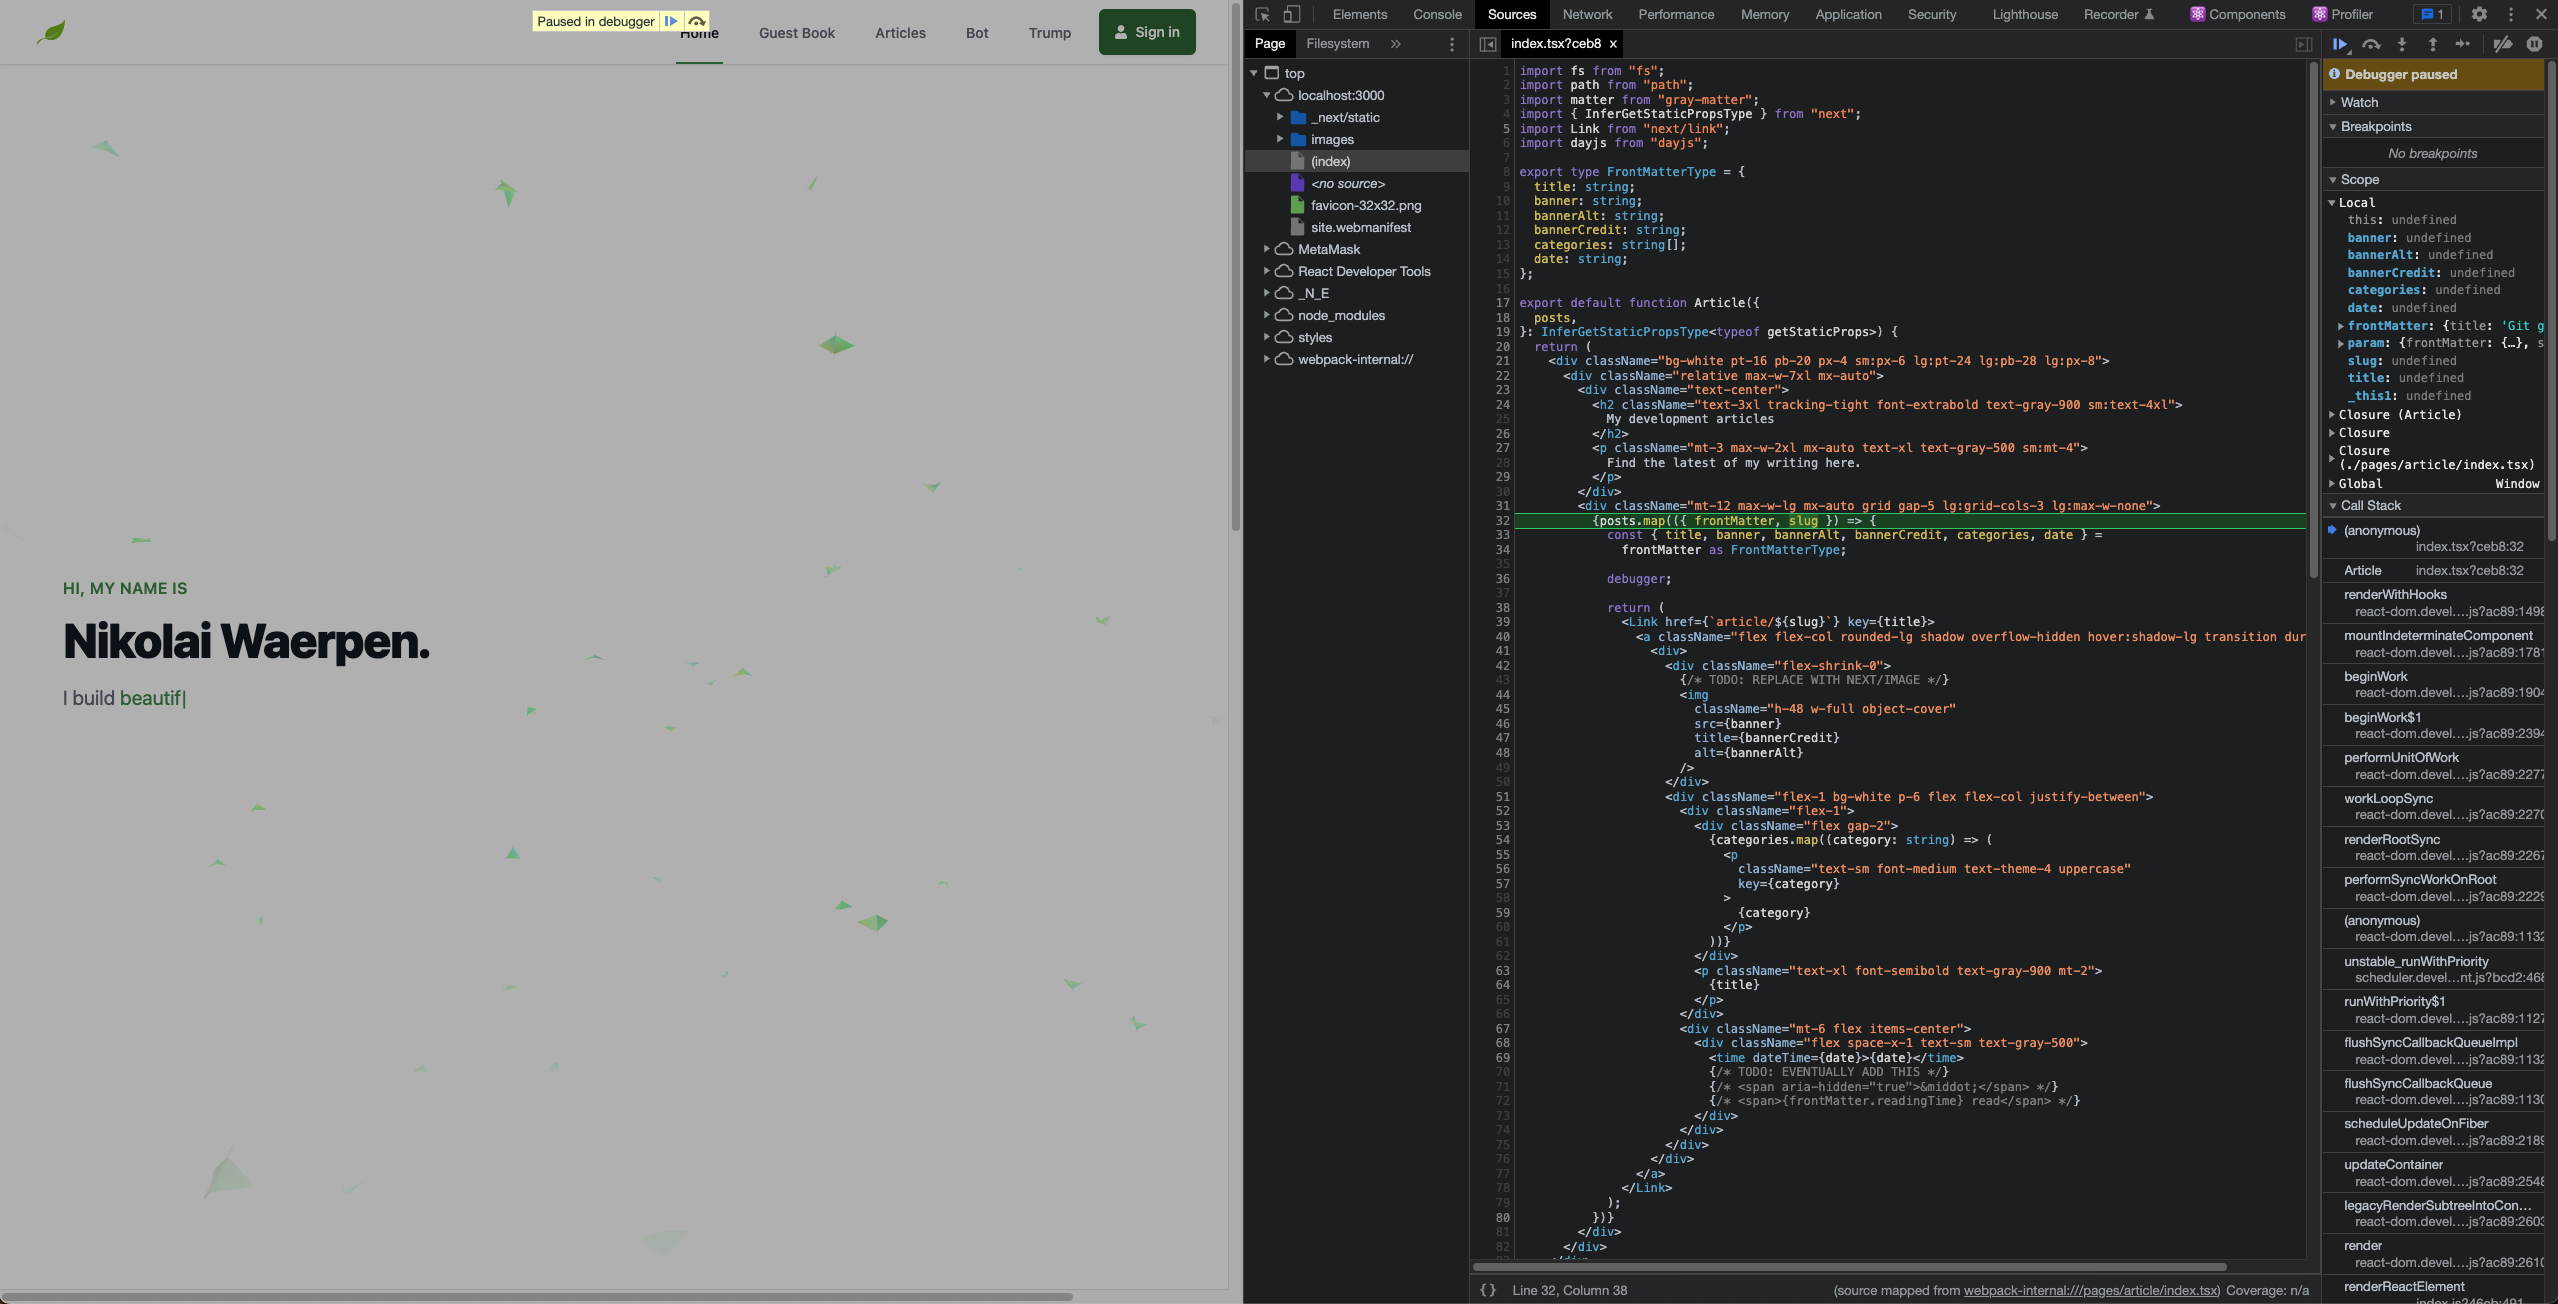
After console.log, debugger is my favorite quick and dirty debugging tool. If you place a debugger; line in your code, Chrome will automatically stop there when executing. You can even wrap it in conditionals, so it only runs when you need it.
    function somePotentiallyBuggyCode() {
      const somethingFailed = Math.random() > 0.5;

      if (somethingFailed) debugger;
    }

    somePotentiallyBuggyCode();

Conclusion
In summary, there are many ways to debug your JavaScript code. I hope you find this article helpful and useful. If you have any questions, don't hesitate to contact me.
